PREPARED 26 MARCH 2024
Synopsis: Periods of severely high rainfall (storms) have always regularly affected most regions of Australia. This Note refers to the analysis of the 148 years of rainfall records since 1876 at Moruya Heads on the south coast of New South Wales. Over that period storm totals (over durations of up to six days) exceeded 200 mm on 36 occasions, with five events exceeding 400 mm.
Moruya Heads is a small coastal village located in southern New South Wales. The region experiences mild summers and mild winters.

DATA USED
The present analysis is based on daily rainfall records to identify storms with total rainfalls exceeding 100 mm. Daily rainfall data are available at Moruya Heads since June 1875 from the website of the Australian Bureau of Meteorology http://www.bom.gov.au/climate/data/ There were two months of missing data, in 2010 and 2015, when data from the nearby Moruya Airport station were used. The latest data used were for December 2023. For this analysis the 148 complete years, 1876-2023, were used.
The data used were the “daily totals” which is the cumulative total rainfall for the 24 hours to 9 am.
OVERVIEW
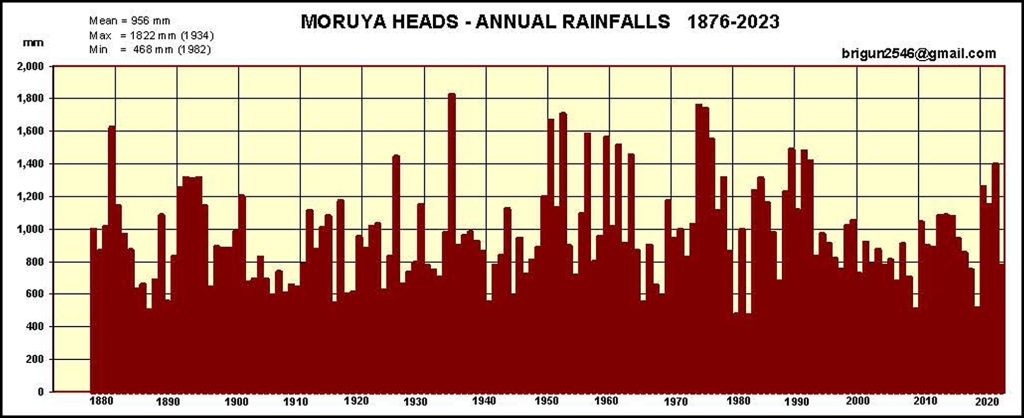
The mean annual rainfall at Moruya Heads is 956 mm with individual yearly totals ranging from 468 mm (in 1982) to 1,822 mm (in 1934). Monthly rainfall totals have been as high as 868 mm (May 1925) while daily totals have been as high as 275 mm (27 May 1925).
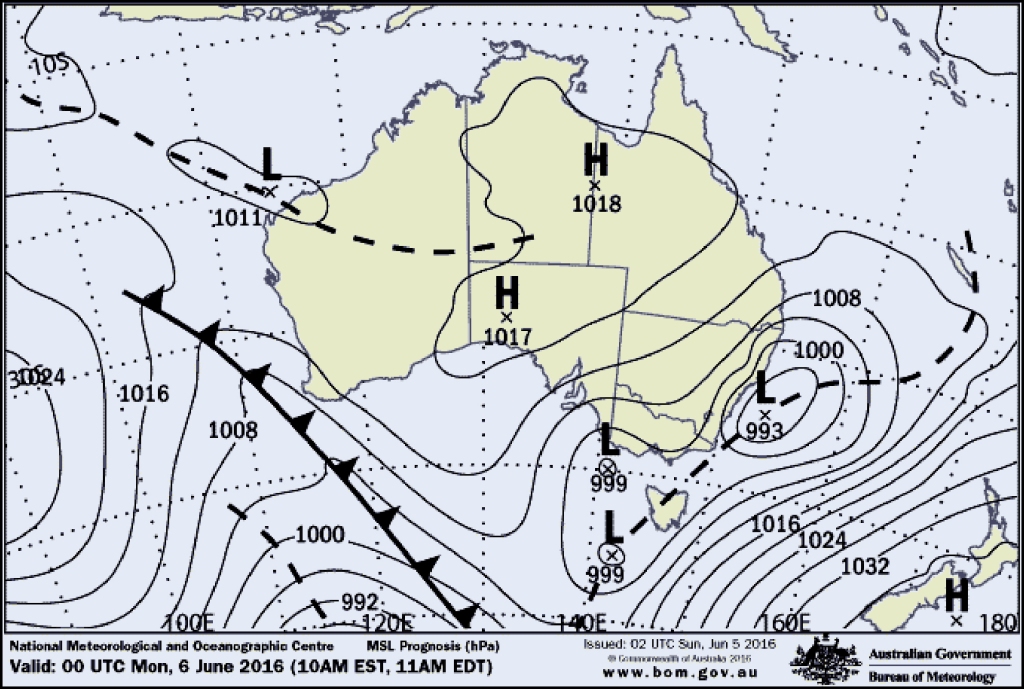
Storm rainfalls exceeding 100 mm occur at Moruya Heads on an average of 1.2 times per year. Most of these events occur during an “East Coast Low” (see synoptic map below) when a low pressure weather system off the coast results in fairly continual rain over a period of several days.
For the purpose of this analysis a “storm” is defined as a rain event when all consecutive daily rainfalls exceed 20 mm. Most storm events extend over only two or three days but there are some examples when the event extended up to six days. The highest storm rainfalls recorded since 1875 were in May 1925 (538 mm) and February 1977 (531 mm). Storm rainfall totals exceeding 100 mm occur in most years.
TIME SEQUENCE OF STORMS
The plot of storms over the 148-year period (1876-2023) at Moruya Heads shows that there have been no increasing or decreasing trend over that period. The highest storm total was 538 mm in 1925.
During the 1970s there were nine storms exceeding 200 mm.

FREQUENCY AND MAGNITUDE OF STORMS
Over the past 148 years (1876-2023) storms at Moruya Heads exceeding 100 mm have occurred on 182 occasions. Of these, 146 (80%) were in the 100-200 mm range. 26 storms (14%) were in the 200-300 mm range, while five (3%) were in the 300-400 mm range. Three storms (2%) were in the 400-500 mm range, while there were two storms (1%) were in the 500-600 mm range. The largest storm was 538 mm in May 1925.
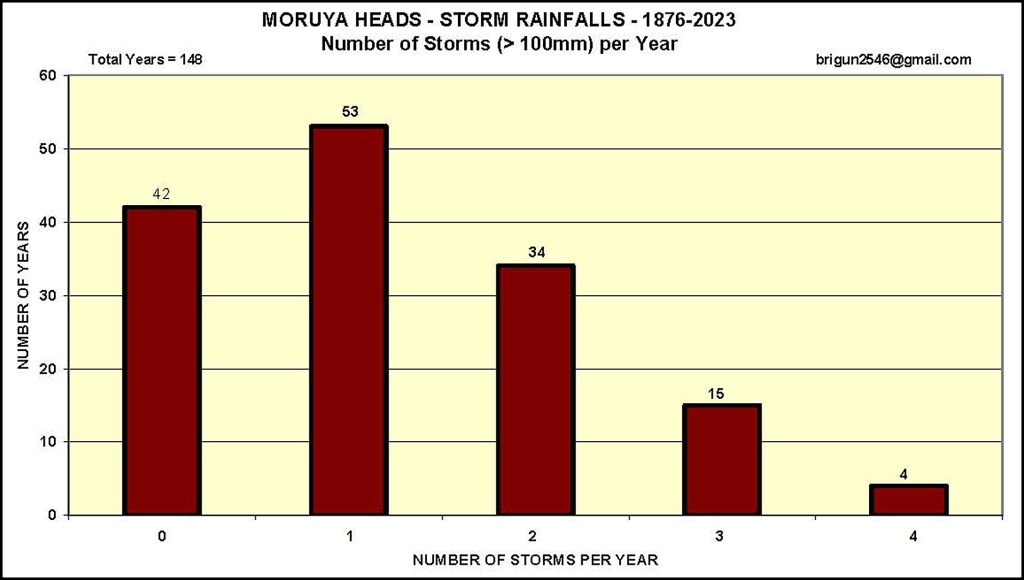
Storms exceeding 100 mm occurred in 72% of years, sometimes up to four times per year. In 36% of years there was only one such storm (>100 mm), while in 23% of years there were two such storms. Such storms occurred three times in 10% of years, but four times in only 3% of years.
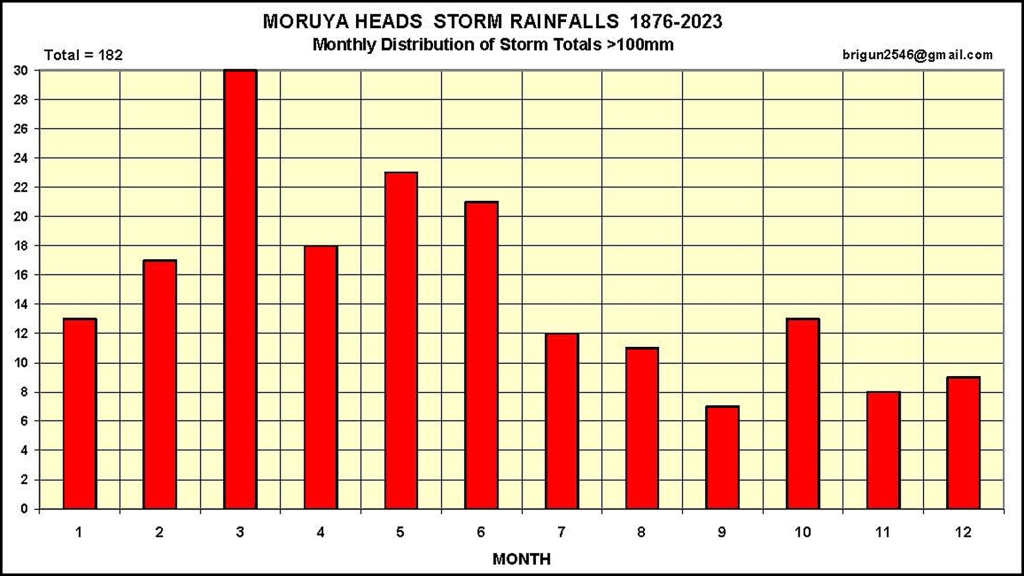
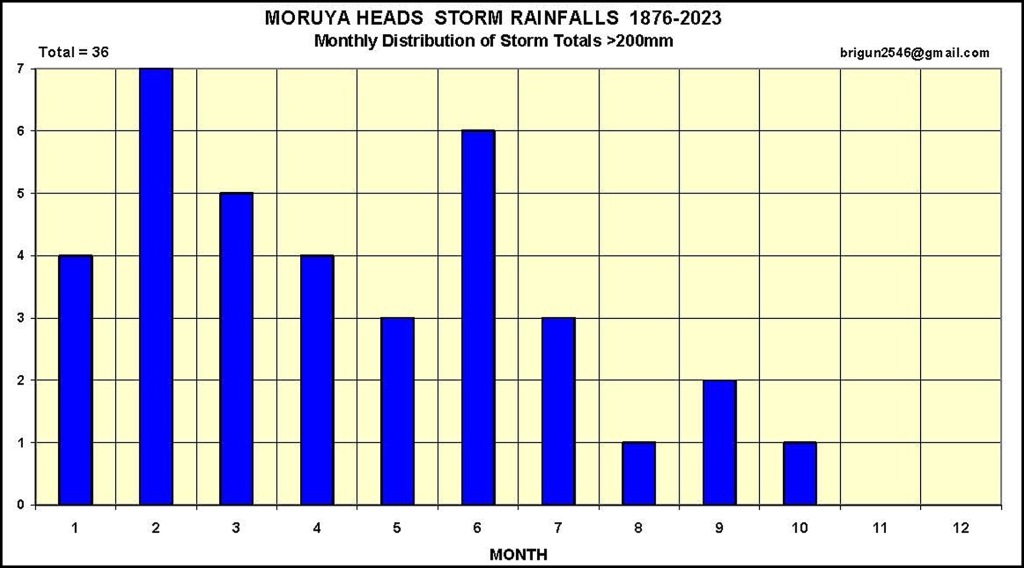
SEASONAL DISTRIBUTION OF STORMS
Storms exceeding 100 mm can occur in any month of the year. However, most occur in the January-June period. The most common months are March (for >100 mm) and February (for >200 mm).

MAJOR HISTORICAL STORMS
Over the 148-year period 1876-2023 there were ten storms that exceeded 300 mm. The two largest storms were both over four-day periods and occurred in May 1925 (538 mm) and February 1977 (531 mm). The longest duration storm extended over six consecutive days; 350 mm in June 1975.

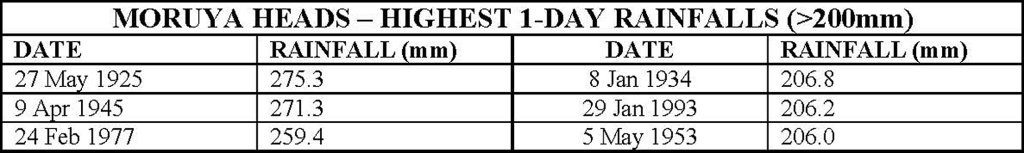
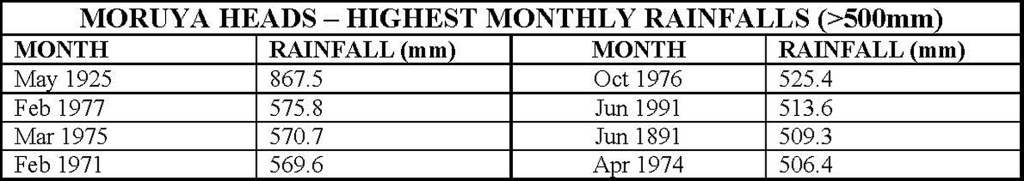
MAJOR DAILY & MONTHLY RAINFALLS
Daily and monthly rainfall data, when used for individual days or months, can be misleading. This is because daily observations are made for the 24-hours up to 9 am and monthly rainfall totals are for the month up to 9 am on the first day of the following month. Some major storms straddle the 9 am daily observation time and some straddle the end of a month.
Nevertheless, it is interesting to document the highest rainfalls recorded at Moruya Heads on individual days and months. The highest 1-day rainfall was 275 mm on 27 May 1925, while the May 1925 monthly total was 868 mm.
COMMENTS
For the purpose of this analysis, a “storm” is defined as a rain event when recorded daily rainfalls (to 9 am) exceeded 100 mm on consecutive days.
Storms can occur at Moruya Heads in any month of the year, although they are more common during the January-June period.
On average, there are 1.2 storms per year exceeding 100 mm. About 80% of these storms are less than 200 mm, but individual storm totals can exceed 500 mm.
Storms exceeding 100 mm occur in 72% of years and up to four such storms can occur in individual years.
Major storms exceeding 300 mm generally occur over a 3 or 4-day period, but up to a 6-day period has been recorded.
The highest recorded storm rainfall at Moruya Heads is 538 mm (25-28 May 1925). The highest daily and monthly rainfalls are respectively 275 mm and 868 mm, both in May 1925.
Over the 148-year period (1876-2023) of records at Moruya Heads there was no significant trend in the intensity, frequency or duration of storms.
Please let me know what you think of my analysis.
brigun2546 (at) gmail.com
THE AUTHOR
 This Note was written by Brian Gunter of Narooma, NSW, Australia. In his previous life Brian was an engineering hydrologist involved over many years in the analysis of rainfall and river flow data for the planning of water resources projects in Australia, Asia and Africa. In recent years he has been one of the Marine Rescue NSW (previously Royal Volunteer Coastal Patrol) volunteer weather observers who operate the Narooma station for the Bureau of Meteorology.
Published by
Brian Gunter
Retired civil engineer.
Particularly interested in climate trends.
View all posts by Brian Gunter
