Synopsis: Severe droughts (and floods) have always regularly affected most regions of Australia, particularly the central and southern regions. This Note refers to the analysis of the 148 years of rainfall records since 1875 at Moruya Heads on the south coast of New South Wales. Eight periods were identified when medium-term or long-term major droughts have occurred at Moruya Heads. The analysis only examined the rainfall records although it is recognised that other factors such as temperature, wind, areal extent and non-meteorological matters (eg farming practices and the economic situation) may also affect drought severity. Furthermore, the severity of a drought differs depending on the end-user (eg town water supply or ecological impact).
Moruya Heads is a small coastal village located in southern New South Wales. The region experiences mild summers and mild winters.
DROUGHT DEFINITION
The usual definition of a drought is a period when the rainfall is less than normal for a sufficient period to affect human activities or natural processes. Although rainfall is the primary factor affecting the severity of droughts, other meteorological factors (such as temperature, wind and humidity) and non-meteorological factors (such as farming practices and economic conditions) also affect the severity of droughts on the local population. Even with rainfall, the drought effect will be different depending on the areal extent, the seasonal distribution and intensity of rainfall. The severity of a drought has different significance for different situations. For example, the different impact of a given drought on dry-land livestock farmers, irrigation farmers, town water supplies, horticulturists or environmental interests.
The present analysis is based on monthly rainfall records only and the identification of severe drought periods are mainly for periods between one and ten years.
DATA USED
Monthly rainfall data are available at Moruya Heads since June 1875 from the website of the Australian Bureau of Meteorology http://www.bom.gov.au/climate/data/ There were two months of missing data in 2010 and 2015, when data from the nearby Moruya Airport station were used. The latest data used were for December 2022.
ANNUAL RAINFALLS
The mean annual rainfall at Moruya Heads over the period 1875-2022 was 957 mm, with annual (Jan-Dec) totals ranging from 468 mm (in 1982) to 1,822 mm (in 1934). On average about 60% of the annual rainfall occurs over the 6-month period, January to June.
It is seen that several drought periods are identified when the annual rainfall (Jan-Dec) was less than the mean annual rainfall. Six periods when the annual rainfall at Moruya Heads were less than the mean value for five or more consecutive years were: 1882-1886 (5 years), 1901-1910 (10 years), 1938-1942 (5 years), 1944-1948 (5 years), 1964-1968 (5 years) and 2000-2009 (10 years).
SHORT-TERM DROUGHTS
Monthly rainfalls of zero are relatively rare at Moruya Heads, having occurred in only five months over the 148-year period 1875-2022. These were in May 1878, April 1888, May 1909, May 1957 and July 1970.
Monthly rainfalls of less than 5 mm were recorded in 55 years.
MEDIUM-TERM DROUGHTS
Rainfall totals of less than 120 mm over 6-month periods have occurred during seven drought periods over the 148-year period 1875-2022. These were in Jul 1907 – Jan 1908, Jul-Dec 1928, Jun-Nov 1944, Mar-Aug 1954, Jun-Nov 1968, Apr-Sep 1980 and Jun 2002 – Jan 2003.
Note that 6-monthly rainfall totals of less than 120 mm occurred on several occasions during the identified drought periods.
Similarly, rainfall totals of less than 800 mm over 18-month periods have occurred during five drought periods over the 148-year period 1875-2022. These were in May 1884 – Sep 1886, Aug 1904 – Jan 1906, Jul 1907 – Dec 1908, May 1939 – Oct 1940 and May 1978 – Jan 1981.
Note that 18-monthly rainfall totals of less than 800 mm occurred on several occasions during the identified drought periods.
LONG-TERM DROUGHTS
Rainfall totals of less than 2,000 mm over 36-month periods have occurred during five drought periods over the 148-year period 1875-2022. These were in May 1882 – Jan 1887, Jul 1900 – Aug 1903, Aug 1904 – Nov 1910, Oct 1939 – Sep 1942 and Jun 1979 – Feb 1983.
Note that 36-monthly rainfall totals of less than 2,000 mm occurred on several occasions during the identified drought periods.
Similarly, rainfall totals of less than 3,800 mm over 60-month periods have occurred during seven droughts over the 148-year period 1875-2022. These were in Aug 1880 – Jan 1990, Apr 1896 – Mar 1899, Jun 1902 – Jun 1912, Oct 1939 – Apr 1943, Aug 1965 – Oct 1969, Jul 1980 – Jul 1983 and Mar 2004 – Jan 2011.
Note that 60-monthly rainfall totals of less than 3,800 mm occurred on several occasions during the identified drought periods.
DROUGHT INTENSITY
Rainfall totals were extracted for four durations (ranging from 6 months to 60 months) continuously for the period June 1875 to December 2022. These totals were ranked to determine the five periods with minimum (drought) rainfalls. Note that the rainfalls identified are for the periods up to the specified dates. For example, the lowest 36-month rainfall total recorded was 1,620 mm over the period June 1883 to May 1886. The results, for durations of 6, 18, 36 and 60 months, are as follows:
DROUGHT DURATION
As referred to in the introduction droughts can be of various durations, depending on the end-user. The critical duration of a drought could vary from a few months to many years.
The above sections refer to droughts with durations of between 1 month and 60 months (5-years). Eight drought periods were identified.
From an examination of the annual rainfall totals at Moruya Heads five periods longer than ten years were identified where the annual rainfalls were less than the mean value (957 mm) for most years. These were: 1881-1889, 1895-1910, 1935-1949, 1964-1973 and 1993-2019.
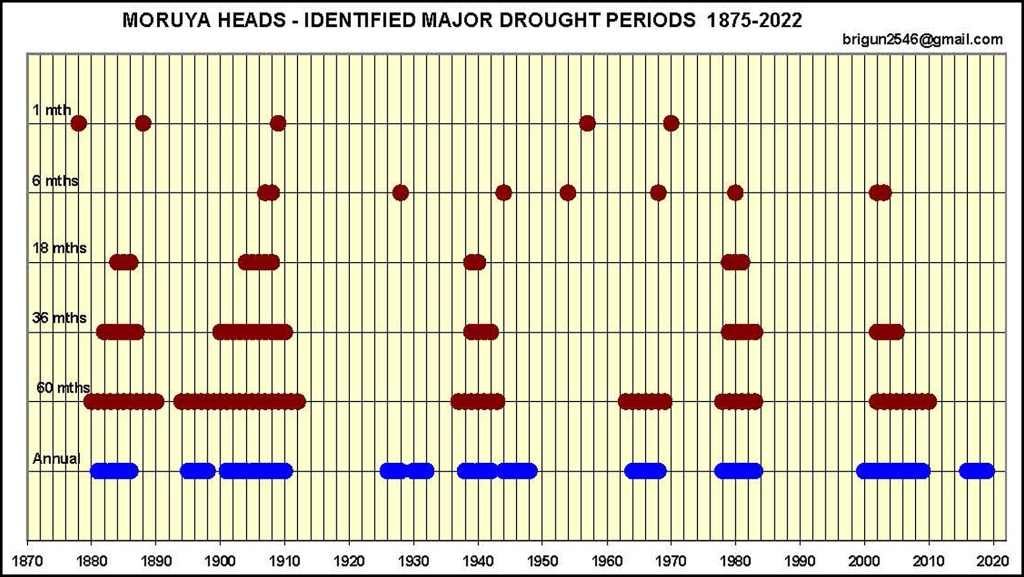
MAJOR HISTORICAL DROUGHTS
For each of various durations (1-month to 60-months) over the 148-year period 1875-2022 the most severe drought periods have been identified. Periods when there were consecutive years of below-average annual rainfall were also identified.
It is seen that, for periods of 18 months and longer there were eight periods within which major droughts were experienced. These were: 1880-1890, 1900-1912, 1926-1932, 1937-1948, 1963-1969, 1978-1983, 2000-2010 and 2016-2019.
Shorter duration droughts (1-month and 6-month durations) generally occurred within the same periods as the longer duration droughts.
DROUGHT TRENDS
The long-term trends of droughts at Moruya Heads have changed little in severity, duration or frequency over the past 148 years. The following plot shows, for the five durations, the minimum rainfall total for each decade. The time scale is plotted at the mid-decadal dates.
ANNUAL RAINFALL DURING MAJOR DROUGHTS
Annual rainfalls for five of the major long-term droughts at Moruya Heads are plotted as follows:
1881-1899 Period
1901-1910 Period
1926-1933 Period
1935-1948 Period
2000-2009 Period
COMMENTS
– Eight major longer-term drought periods were identified over the period since 1875, at an average interval of about 20 years. These were during the periods 1880-1890, 1900-1912, 1926-1932, 1937-1948, 1963-1969, 1978-1983. 2000-2010 and 2016-2019.
– During two droughts (1901-1910 and 2000-2009) the annual rainfalls at Moruya Heads were below average for ten consecutive years.
– Severe shorter-term droughts (say 6-months or 18-months duration) generally occurred during the same periods as longer-duration droughts.
– There were no significant changes in the severity or frequency of droughts over the past 148 years.
– The analysis involves the study of only monthly rainfall data. Although rainfall is the primary factor affecting the severity of droughts, other meteorological factors (such as temperature, wind and humidity) and non-meteorological factors (such as farming practices and economic conditions) also affect the severity of droughts. Even with rainfall, the drought severity will be different depending on the seasonal distribution and intensity of the rainfall.
– The severity of a drought has different significance for different situations. For example, the different impact of a given drought on dry-land livestock farmers, irrigation farmers, town water supplies, horticulturists or environmental interests.
Please let me know what you think of my analysis.
brigun2546 (at) gmail.com
THE AUTHOR
This article was written by Brian Gunter of Narooma, NSW, Australia. In his previous life Brian was an engineering hydrologist involved over many years in the analysis of rainfall and river flow data for the planning of water resources projects in Australia, Asia and Africa. In recent years he has been one of the Marine Rescue NSW (previously Royal Volunteer Coastal Patrol) volunteer weather observers who operate the Narooma station for the Bureau of Meteorology.


 This article was written by Brian Gunter of Narooma, NSW, Australia. In his previous life Brian was an engineering hydrologist involved over many years in the analysis of rainfall and river flow data for the planning of water resources projects in Australia, Asia and Africa. In recent years he has been one of the Marine Rescue NSW (previously Royal Volunteer Coastal Patrol) volunteer weather observers who operate the Narooma station for the Bureau of Meteorology.