UPDATED 28 SEPTEMBER 2022
This post refers to my analysis of recorded monthly mean temperature trends at Kosciusko in Mississippi, USA. The station was established in 1889. The analysis used raw data (as recorded, without any adjustments) as published by KNMI (the Royal Netherlands Meteorological Institute). No estimates were made of missing data.

Kosciusko is a small town in central Mississippi, USA. The town is about 300 km north of the Gulf of Mexico.
Over the period August 1889 to July 2019 (a period of 130 years) 85 months of data were missing. These were mainly in 10 calendar years.
Kosciusko has a humid sub-tropical climate with hot humid summers and mild-cool winters. Mean monthly temperatures vary from 6.9°C in January to 26.9°C in July. Extreme monthly mean temperatures recorded are -0.9°C (in January 1940) to +29.6°C (in July 1930).
Mean Maximum and Minimum Monthly Temperatures:

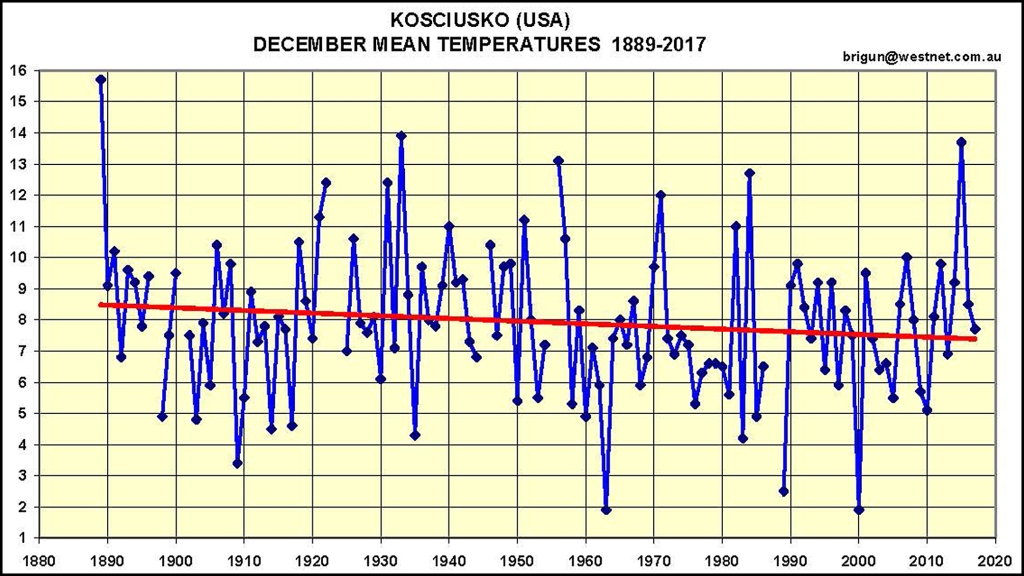
Plots are shown below for annual mean temperature and the monthly mean temperature for each of the 12 months. On each plot a linear trendline has been added. It should be noted that this linear trendline does not imply that there is a linear temperature vs time trend, but is shown to allow the reader to visualise the variation in temperature compared with the long-term trend.
ANNUAL MEAN TEMPERATURES

MONTHLY MEAN TEMPERATURES
January

February

March

April

May

June

July

August

September

October

November

December
COMMENTS
· The plots show a strongly cyclical annual trendline, with similar cyclical trendlines in many months.
· The cyclical trendlines have peaks around 1930 and 2010(?) and troughs around 1900(?) and 1980, a cycle period of about 80 years.
· Negative or flat linear trendlines occur in all twelve months.
· The linear trend rate over the period of records varies from -2.0°C/century (in January) to +0.0°C/century (in July).
· The corresponding linear trend rate for the annual mean temperatures is -0.6°C/century.
· There are no abnormal changes in the temperature trendlines in recent decades.
————————————————–
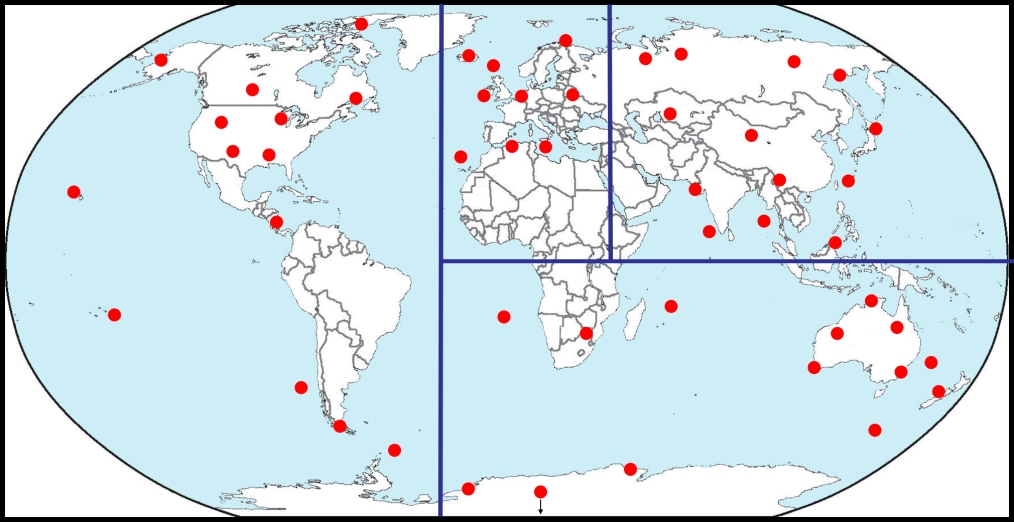
Kosciusko is one of 250 stations, worldwide, for which I have analysed long-term temperature trends. The analyses at 50 representative stations are summarised in the blog post: world-50-temperatures
Please let me know what you think of my analyses. brigun2546 (at) gmail.com
THE AUTHOR
 This article was written by Brian Gunter of Narooma, NSW, Australia. In his previous life Brian was an engineering hydrologist involved over many years in the analysis of rainfall and river flow data for the planning of water resources projects in Australia, Asia and Africa. In recent years he has been one of the Marine Rescue NSW (previously Royal Volunteer Coastal Patrol) volunteer weather observers who operate the Narooma station for the Australian Bureau of Meteorology.
